Migrenio, explained from the inside
A migraine diary that logs your attack in ten seconds and keeps all your data on your own phone. Below: how the app is put together, and what each screen does.
Three choices that decide everything
Every decision in the app comes back to these three principles. They explain why Migrenio works differently from the well-known migraine apps.
Logging during an attack
During an attack, light hurts and you feel sick. One tap starts a log; all details are optional and can wait. The attack screen is extra dark with large buttons.
Your data stays yours
No account, no cloud, no server of ours. Everything lives in a database on your phone. There is nothing to sign in to, and we cannot see or share anything of yours.
Context without typing
Barometric pressure is recorded automatically with every attack, using the sensor in your phone. You get insight without filling anything in.
Where the app lives: on your phone
Migrenio is one app that runs on both Android and iPhone, built from a single shared codebase. The heart of the app is a small database that sits entirely on your device — that is where your attacks, medication, triggers and notes are kept.
Because there is no server of ours, in principle nothing goes out. The one exception is air pressure: if your phone has no built-in barometer, or you turn on pressure alerts, the app asks a free weather service for the pressure (and the outlook) — with your location coarsely rounded and without any health data.
If you want to share data — a report for your doctor, say — that only happens on your own initiative: you create the export and choose who gets it.
What you see and do on each screen
Four main screens in the bottom bar, a separate flow for logging an attack, and a few supporting pages.
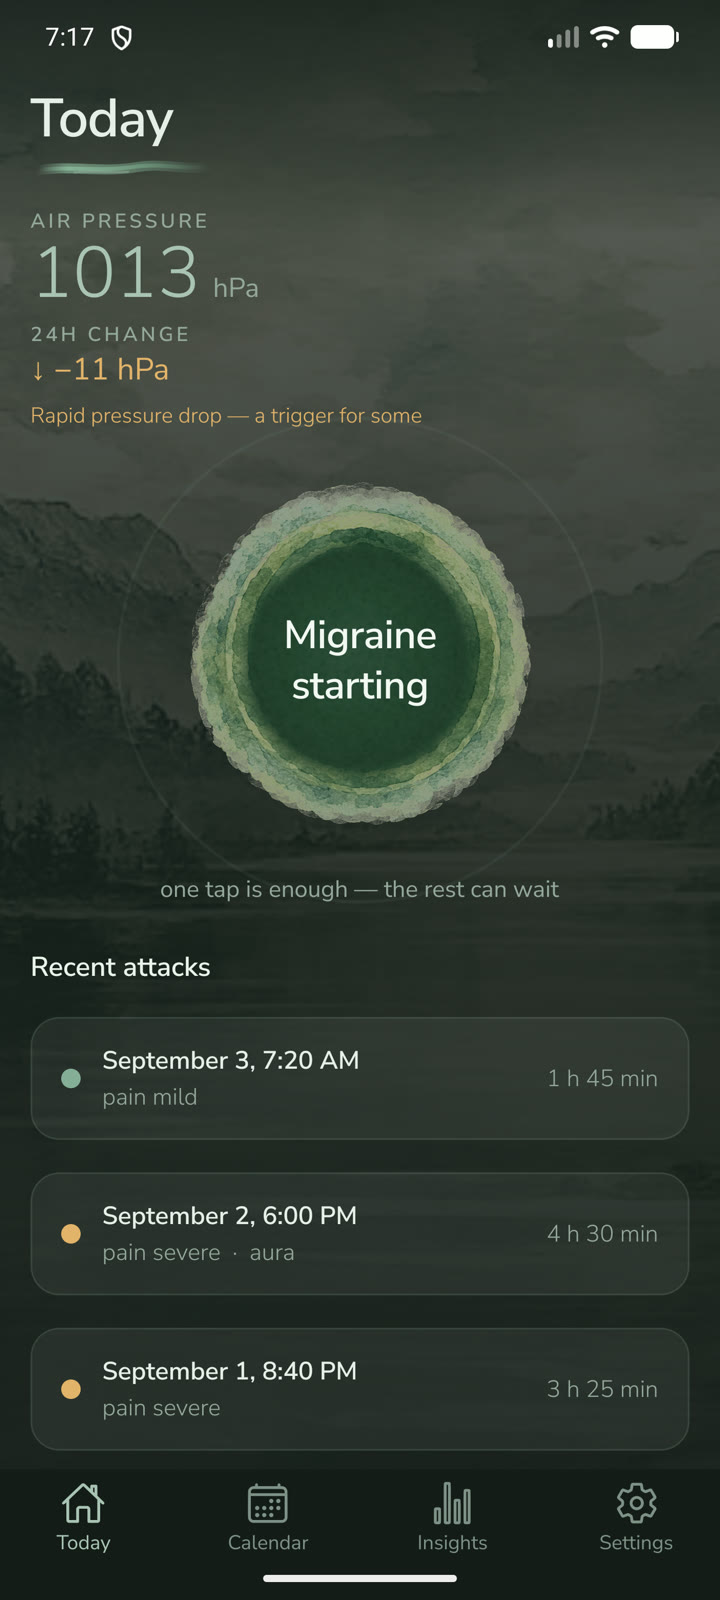
Today Home screen
Where you arrive and start an attack.
You see: the current air pressure, the change over 24 hours, a large flower button and your latest attacks.
You do: one tap on the flower — “Migraine starting” — immediately starts a log. Nothing more is needed. The button pulses gently so it looks touchable.
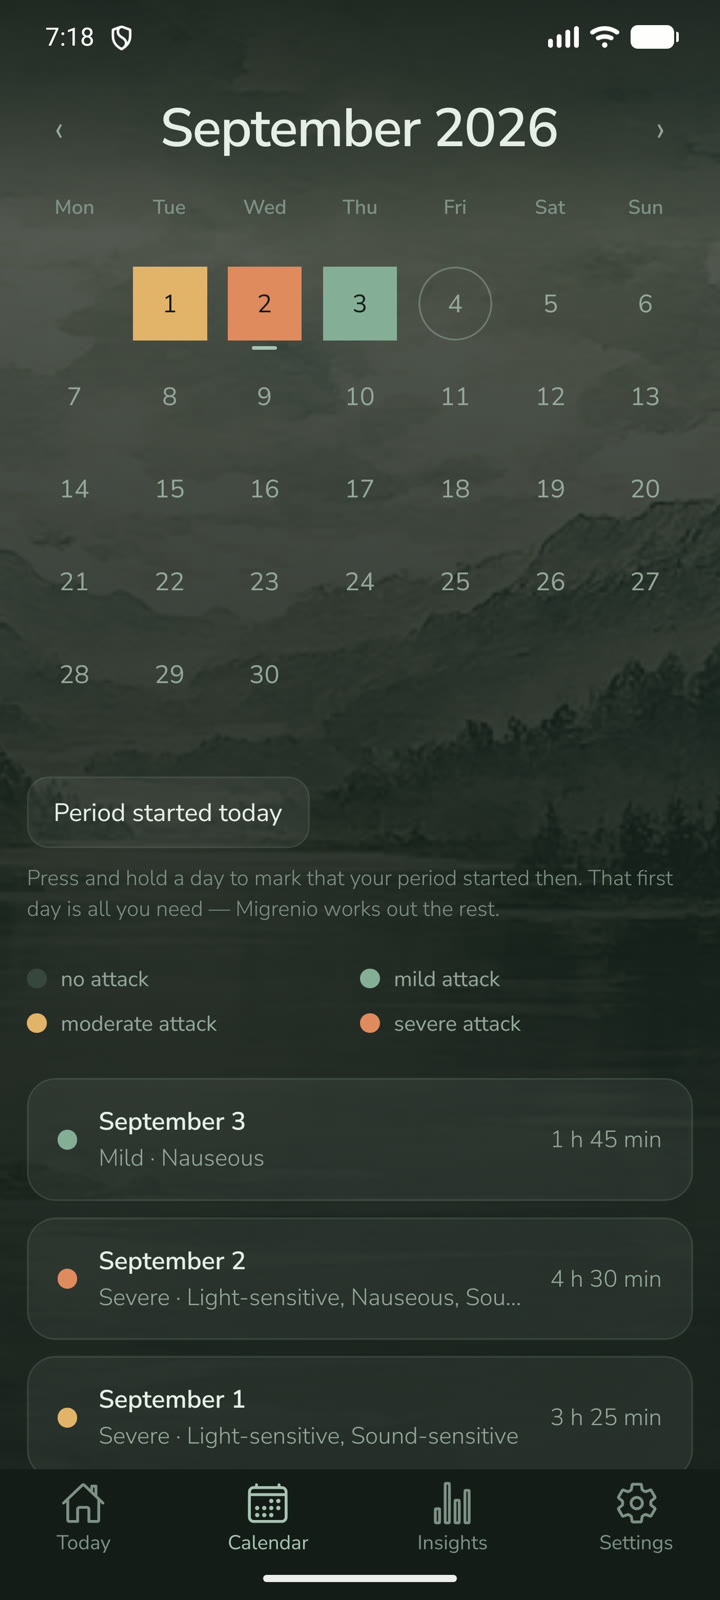
Calendar Overview
Your month at a glance.
You see: a month grid in which each day gets a colour by severity: green is mild, amber moderate, terracotta severe. Below it, the list of attacks.
You do: tap a day or an attack to view it or add to it.
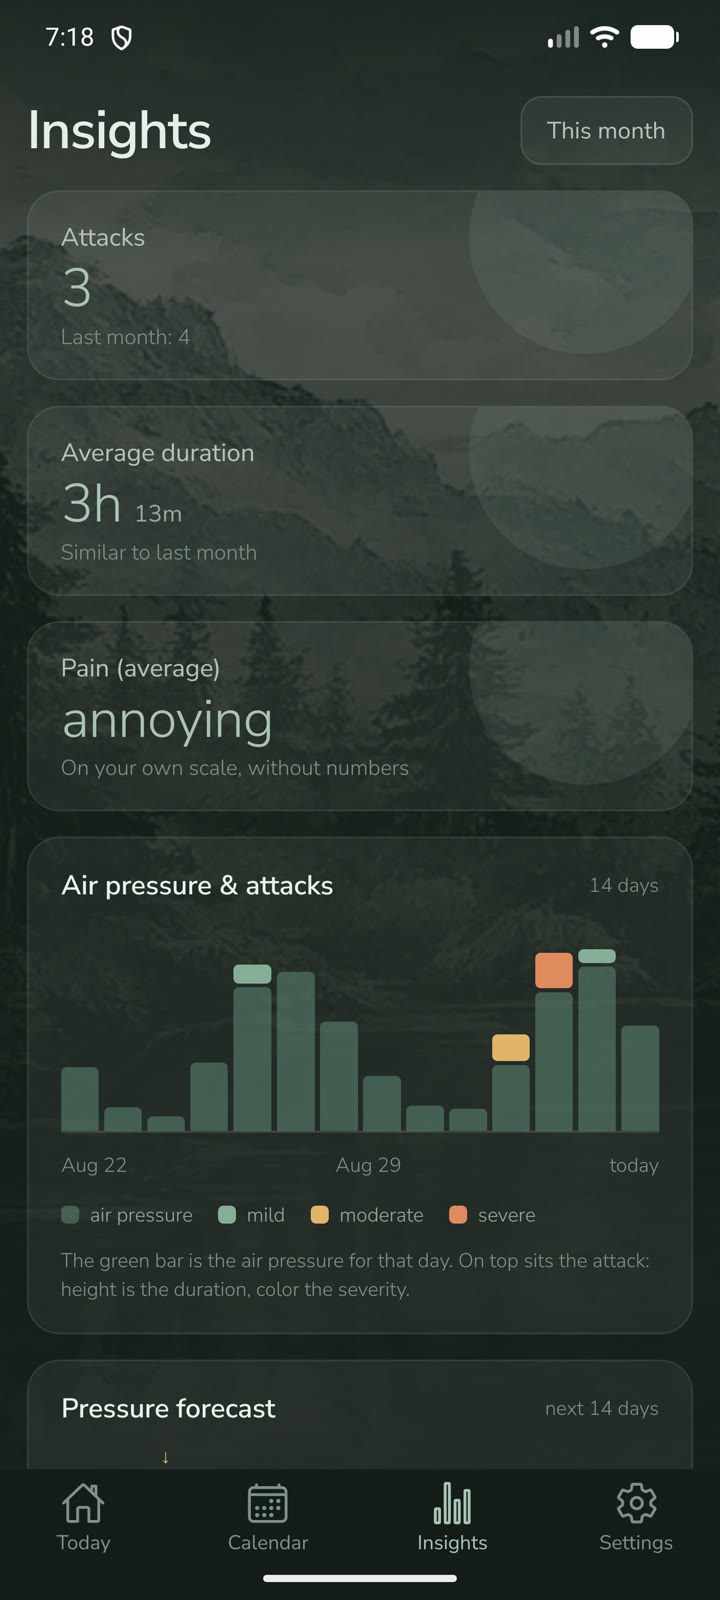
Insights partly Premium
What your data tells you — with statistical honesty.
You see: number of attacks, average duration and pain; a chart of air pressure alongside your attacks; and with Premium: correlations, the 14-day pressure outlook, which medication helped how often, and health patterns.
You do: read. It deliberately also shows “no link found” or “not enough data”. At the bottom you open the doctor's report.
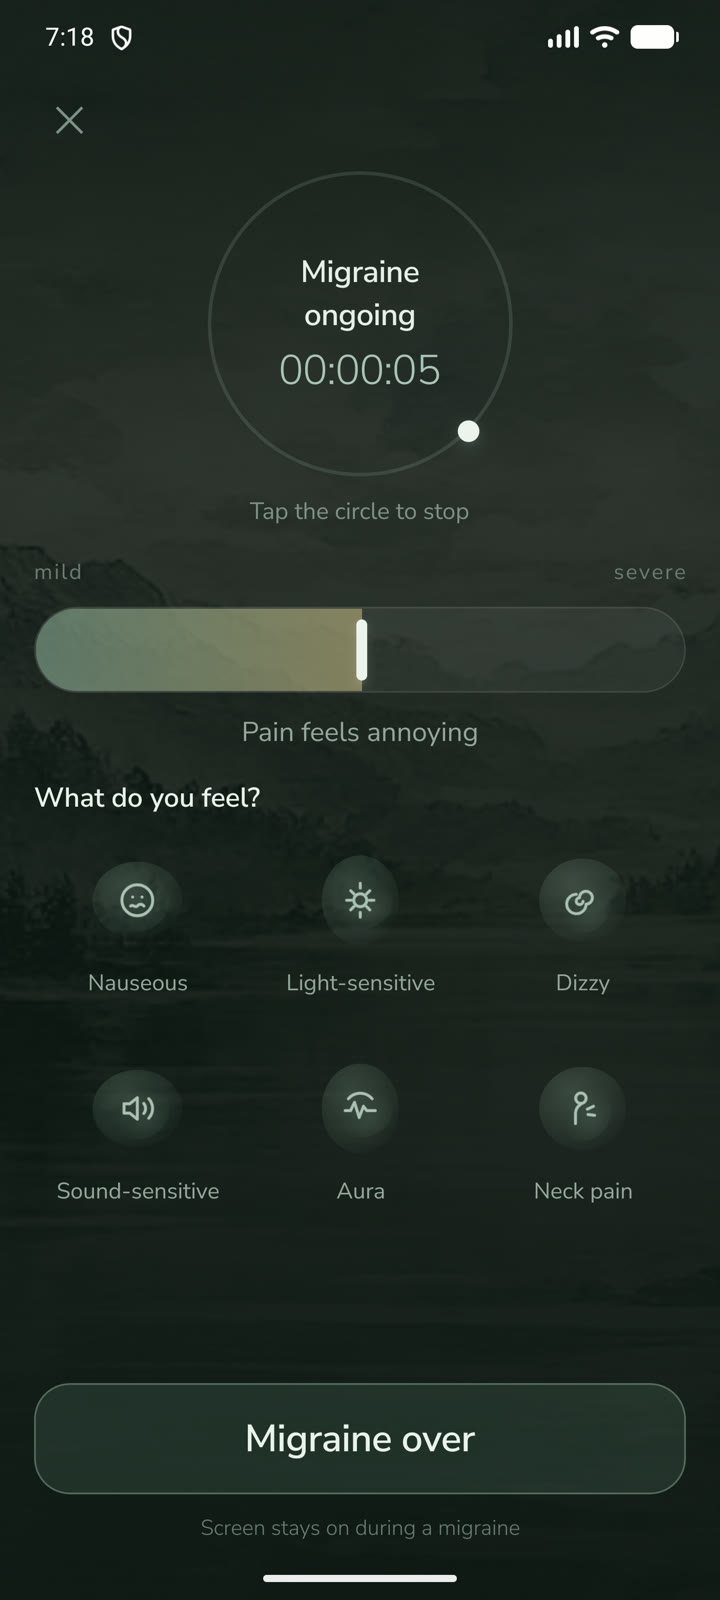
Active attack Full screen
The calmest, darkest screen in the app.
You see: a running clock and a large circle to tap, on the darkest background — deliberately bare, because during an attack calm is what counts.
You do: pain and symptoms can be filled in now, later or never. One tap on the circle ends the attack.
The supporting screens
You reach these screens from the bottom bar or the attack flow.
Settings
Make everything your own.
You do: manage Premium, choose a language, maintain your medication list, turn pressure alerts and Health Connect on or off, and open the doctor's report, the symptom guide and the privacy story.
Completing an attack
The details, when you are ready for them.
You do: pain with a slider, where the pain sits, symptoms, triggers, medication (and whether it helped) and a note — which you can also dictate, entirely on your device. The weather appears automatically at the top.
Symptom guide
What do the symptoms mean?
You see: a calm explanation of the symptoms, including aura. Purely informative — Migrenio is a diary, not a diagnosis or treatment tool.
Doctor's report Premium
A tidy summary for your neurologist.
You do: choose a period (month, 3 months or everything). The app turns it into a PDF, including the MIDAS questionnaire, which you share yourself.
Premium
What the paid version adds.
You see: the extras at a glance — analyses, medication effectiveness, the doctor's report and the pressure alerts — with the price and a free trial month. Logging always stays free.
A few terms, briefly explained
Came across a name above you do not know? Here is what it is, in one sentence.
- Barometer — The air pressure sensor that many phones already have built in.
- Open-Meteo — A free weather service; provides the current air pressure and the multi-day forecast.
- Health Connect — Android's local vault for health data. With your permission, Migrenio reads only your sleep duration and heart rate variability (HRV) from it and writes nothing back. On iPhone, Apple Health plays the same role.
- On-device speech — Dictating your note, converted to text on the device itself; no audio goes out.
- PDF export — The doctor's report is turned into a PDF on your phone, which you share yourself.
- Google Play Billing — Google's payment system, through which the Premium purchase runs — directly, without an intermediary. On iPhone that is the App Store.